The Demographic Environment
The main demographic factor marketers monitor is population, including the size and growth rate of population in cities, regions, and nations; age distribution and ethnic mix; educational levels; and household patterns.
Worldwide Population Growth
The global population currently tops 7 billion people and is forecasted to rise to 8.82 billion by 2040 and exceed 9 billion by 2045.
Developing regions house 84 percent of the world’s population and are growing at 1 percent to 2 percent per year; developed countries’ populations are growing at only 0.3 percent.15 In developing countries, modern medicine is lowering the death rate, but birthrates remain fairly stable.
A growing population does not mean growing markets unless there is sufficient purchasing power. Education can raise the standard of living but is difficult to accomplish in most developing countries. Nonetheless, companies that carefully analyze these markets can find opportunities and some-times lessons they can apply at home.
Population Age Mix
There is a global trend toward an aging population. In 1950, there were only 131 million people 65 and older; in 1995, their number had almost tripled to 371 million.
By 2050, 1 of 10 people worldwide will be 65 or older.
Marketers generally divide the population into six age groups: preschool children, school-age children, teens, young adults age 20 to 40, middle-aged adults 40 to 65, and older adults 65 and older.
Some marketers focus on cohorts, groups of individuals born during the same time period who travel through life together. The defining moments they experience as they come of age and become adults (roughly ages 17 through 24) can stay with them for a lifetime and influence their values, preferences, and buying behaviors.


Diversity within Markets
Ethnic and racial diversity varies across countries, which affects needs, wants, and buying patterns.
At one extreme is Japan, where almost everyone is native Japanese; at the other extreme is the United States, 12 percent of whose people were born in another country. In the United States, more than half the growth between 2000 and 2010 came from the increase in the Hispanic population, which grew by 43 percent, from 35.3 million to 50.5 million, representing a major shift in the nation’s ethnic center of gravity.
Geographically, the 2010 Census revealed that Hispanics were moving to states like North Carolina where they had not been concentrated before and that they increasingly live in suburbs.
Such demographic trends affect the market for all kinds of products, including food, clothing, music, and cars. Yet marketers must not overgeneralize—within each group are consumers quite different from each other.
Diversity also goes beyond ethnic and racial markets. More than 51 million U.S. consumers have disabilities, and they constitute a market for home delivery companies such as Internet grocer Peapod.
Educational Groups
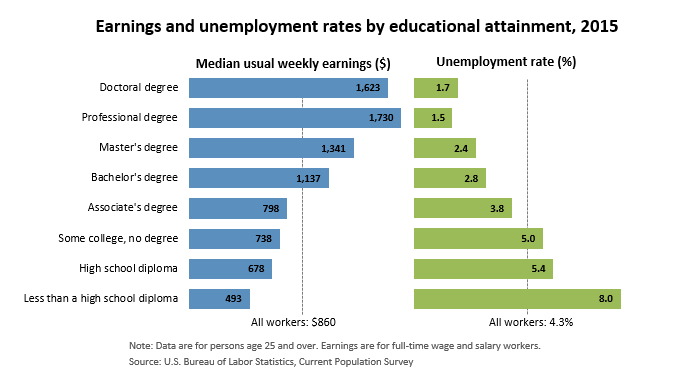
The population in any society falls into five educational groups: illiterates, high school dropouts, high school diplomas, college degrees, and professional degrees.
More than two-thirds of the world’s 793 million illiterate adults are found in only eight countries (Bangladesh, China, Egypt, Ethiopia, India, Indonesia, Nigeria, and Pakistan); of all illiterate adults in the world, two-thirds are women.
The United States has one of the world’s highest percentages of college-educated citizens. This educational level drives strong demand for high-quality books, magazines, and travel and creates a supply of skills.


Household Patterns
The traditional U.S. household included a husband, wife, and children under 18 (sometimes with grandparents). By 2010, only 20 percent of U.S. households met this definition, down from about 25 percent a decade before and 43 percent in 1950.
Married couples have dropped below half of all U.S. households for the first time (48 percent), far below the 78 percent of 1950. The median age at first marriage has never been higher: 26.5 for U.S. brides and 28.7 for U.S. grooms.
Nontraditional households are growing more rapidly than traditional households as more people divorce, separate, choose not to marry, or marry later.
Other types of households are single live-alones (27 percent), single-parent families (8 percent), childless married couples and empty nesters (32 percent), living with nonrelatives only (5 percent), and other family structures (8 percent). Each type of household has distinctive needs and buying habits that marketers need to study and understand.
